

Unless you have been “off the grid,” you are probably aware that we have a Presidential election coming in November. Like with most elections, political rhetoric is all over the news and media outlets. As financial advisors we are focused on how politician’s economic and tax platforms may affect our clients’ portfolios. We have received some phone calls asking that very question, so we decided to write this article sharing some historical facts. We realize that there may be varying beliefs over which political party in office might be better or worse for the stock market and the economy. We hope to clear up some of this behavioral anchoring and share statistics to help us all navigate through the coming months.
Polling
Polling is and has been notoriously inaccurate months before an election. Luckily, professional polling companies have made improvements through lessons learned from the prior election cycle, so we can assume they may be slightly better than in years past. In addition, we learned that it’s more important to focus on individual states, rather than national polling.
The current election will likely be determined by a few swing states, namely Wisconsin, Michigan, Pennsylvania, and Florida. In the past, Florida has been a leading indicator of Presidential election outcomes. In fact, Florida has voted for the Presidential winner in every election since the 1960s.
The current leader in the poles is former Vice-President Joe Biden with a 1.7-point lead over where former Secretary of State, Hillary Clinton was polling 4 years ago in the state of Florida. Clinton went on to lose the State of Florida by 1.2-points last election, and was projected to lose the State of Florida by 0.2 points to President Trump. Biden also has a commanding lead in his home state of Pennsylvania. He has lost a significant amount of momentum in Wisconsin and Michigan, and is currently polling under where Clinton was 4 years ago.
Impact of Political Parties
Although we believe the stock market and U.S. economy have been less affected by who is in office, we can glean to the past to learn how the stock market has performed under different combinations of political parties in control of the Presidency, Senate, and House of Representatives.
As shown in Chart A below, since 1900, a Democratic President with a split congress (regardless of the make-up) has returned 13.6% annualized, while a Republican President with a split congress has returned -2.0% annualized. In addition, the stock market with a Democratic President while encompassing all Senate and House mixes has returned 9.3% annualized, and a Republican President under the same scenario has returned 5.6%.
CHART A
Political Party in Control: Comparative Stock and Economic Returns
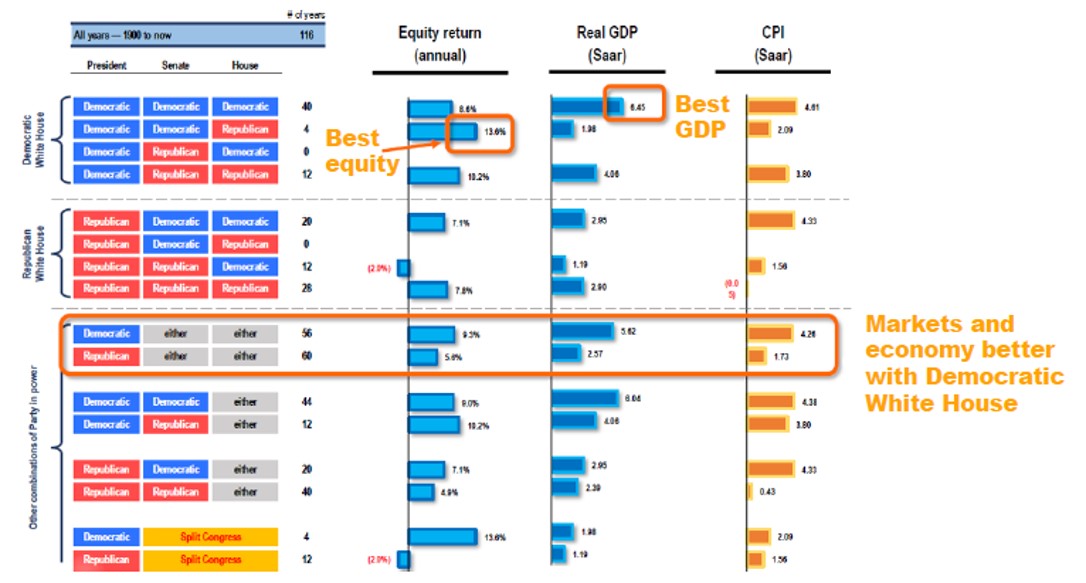
Source: Fundstrat, Bloomberg. Report as of July 30, 2020.
As you can see from Chart B below, the results become even more dramatic when we look at more recent data since 1972. When a Democratic President is in the White House the average results of the stock market are more than double than when a Republican is in power. We can slice and dice the parties in control different ways, but the bottom line is that over the long-term (greater than one year as we will see soon), Democratic control of the White House has been historically better for the stock market.
CHART B
Since 1972

Source: Bloomberg, S&P 500 Price Index, 10 Year U.S. Treasury Yield, Data yearly since 1972, 2020 data through 7/31/2020, calculations by Horizon Investments
The picture for Gross Domestic Product (GDP), a national indicator of economic growth, is like the outcome of the stock market. Any way you look at the data, GDP growth is higher under a Democratic President.
Three months post-election, the stock market return is typically weaker by about 10% after an incumbent Republic President loses. Conversely, an incumbent Republican Presidential win typically results in a strong stock market rally of about 10%. Regardless of the election’s outcome, we know that there are typically varying degrees of volatility around election time. We also know that potential losses – or gains – are temporary.
It’s Not All About the President
The outcome of the economy and the stock market is larger than who is in the White House. This is especially true as our economy continues to become so interconnected with others around the globe. It is fair to say that the U.S. is still the most important cog in the global economic machine. However, India, Japan, and Germany collectively far outweigh the U.S. in terms of importance. Each of these economies have assorted degrees of political momentum – both conservative and liberal. While we currently invest exclusively in the United States, most U.S. based companies’ revenue is derived overseas. This provides diversification among many geographic regions in various parts of the economic cycle.
The Game Plan
It should not surprise you that we already have a game plan for the upcoming election. In fact, this game plan was put in place the day we implemented your portfolio. The process of systematically, and unemotionally rebalancing your portfolios allows us to take advantage of volatility.
Data shows that the process of rebalancing can significantly reduce risk while improving returns compared to a buy-and-hold strategy. The more volatility, the more opportunity there is for us to buy low and sell high.1
For those with taxable accounts this may generate capital gains. We take care to avoid higher taxed short-term gains where we can, in favor of long-term capital gains with more favorable tax rates. Nationally, 25% of all investments are in taxable accounts, while 75% are in IRA’s and pension plans – which are tax deferred.
No one can predict what the outcome of the election will be, and although we are not suggesting that you vote one way or the other, the important thing is that you do go out and vote. Like investing, we must focus on what we know, and what we can control – and you are in control of your vote.
If you are concerned about the possibility of a temporary loss of around 10-15% of the stock market – which would equate to 5-7.5% on our balanced portfolios – please contact us at 631-218-0077, so that we can discuss your financial plan, and provide some comfort and direction.
Please note that even with a temporary loss, you are likely still on track toward your goals. We caution anyone looking to make changes to their portfolios primarily because it requires a second decision to be made to get back to status-quo. This second decision is always the hardest part and usually the most damaging to portfolio performance.
We look forward to updating you on the markets and the election over the coming months. In the meantime, be safe and enjoy the fall weather.
Sincerely,

Steven M. Rogé
Chief Investment Officer
1 Diversification and rebalancing strategies do not ensure a profit and do not protect against losses in declining markets. Investing involves risks including possible loss of principal.